  • Searching For Strong Momentum Stocks?

    Do you know which stock on the index has the most potential?
  • Technical Analysis

    Tired Of Hours Of Analysis

    Picking the same stocks over and over again?
Sign Up To Get Your Strong Stocks List TODAY!

Home

Learn How To Pick Strong Stocks in Any Market

Learn How to Spot Trends and Get In and Out of the Market Easily

Do you know which stock have potential?

Do you have to rely on others to give you tips?

How do you pick from all the listed stocks in a market and don’t miss the boat?

Do you find going through a lot of technical analysis to pick stocks gives you headaches?

You don’t have to go through the haystack to find the needle anymore. 

myStockPoint.com is the easiest tool you can find on the market that helps you pick the most potential stock from any market with little or no knowledge of any technical analysis.

If you understand the 1 – 100 point scoring system, you already understand the basis of our program.  It’s that easy.

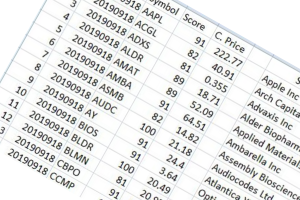
myStockPoint.com analyzes all the listed stock in four of the major indices in the world and return with a score for each stock for each trading day.  A stock with 80 points or higher indicates a “strong” or momentum stock or a stock with great momentum.  Likewise a stock with 30 points or lower indicates the stock is weak and it does not have the momentum to go up.


Our system is superior to other technical analysis systems or stock pick websites on the market for the following reasons:

Strong Reliable Technical Analysis

Since each technical analytic tool has its strengths and weaknesses, a specific tool that gives an accurate trend prediction under certain situations can be totally wrong under other conditions, thus mastering just one or two methods is not enough to generate reasonable results.

myStockPoint combined various methods in technical analysis to evaluate each stock. This way, the strengths of various technical analysis tools are combined whereby avoiding the weakness of any one method while enhancing the overall accuracy of the resulting analysis.

Easy To Understand

No prior technical analysis experience necessary!  Just as children who understand in school what it means by a score of 100 or 50, myStockPoint system is also based on a 100-point scoring system, with scores above 80 indicating high momentum stocks, 60 or above indicating stocks that should be observed longer and scores below 60 is an indication of weaker stocks.

By using this scoring system, any investor can understand whether the stock being analyzed has a strong or weak momentum and make investment decisions accordingly.

Saves Time!  Zoom in on Any Strong Stock Quickly

myStockPoint system processes data for over thousands of active stocks in a given index in a short time for each trading day and return with a report.  Other than specific breaking news that will cause large stock price movements during the day, strong momentum stocks following a normal trend will show up in myStockPoint reports with high scores, thereby helping investors to quickly search for high potential stocks with strong momentum for the day.

No more spending countless hours on technical analysis for a handful of stocks, even for the experienced investors.

No more just trading those familiar stocks or industry or based on other’s stock tips!

We do all the hard work for you.  Just open our daily report and the strongest stock for the whole index are right in front of you. Try it now, risk free for 30 days. It’s the best value investment tool you’ll ever have.